Risk Management Compliment: Volatility Bands
In my last post I shared my max size risk management process: standard move. There is a critical flaw in this process. It assumes that the log returns of the security are normally distributed. If that assumption were true, my standard move would happen 68% of the time. Unfortunately markets are not so orderly, and events that should be so rare they only happen once in a thousand years are actually pretty ordinary – you’ve probably heard of these events called black swans.
To protect myself against this, I intend to purchase options to hedge my position against moves that should be very large and infrequent. Let’s say a 3-standard deviation move, which if normality held would cover 99.7% of all daily moves. By hedging with options that are reasonably far away from the current price, I shouldn’t have to pay up too much, but there’s no free lunch. I’m also considering selling options to finance the protection, but I want to backtest that first!
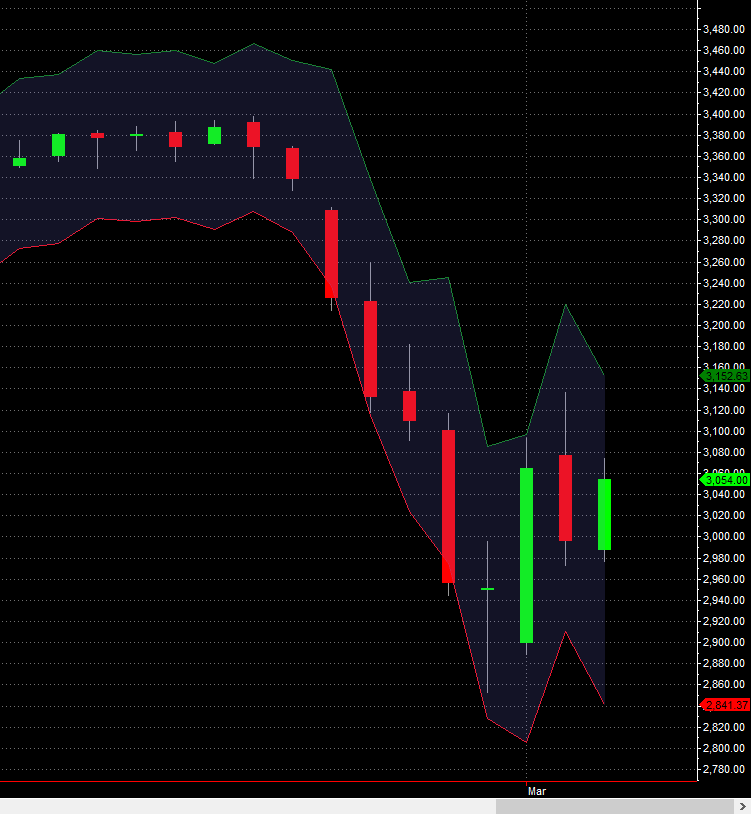
To help determine the strike prices for this protection I developed this indicator for MultiCharts. It is a modification of the standard Bollinger Bands Area code included with the software. Instead of centering the bands at the average price, it centers it at the prior close. It then draws the bands based on the standard deviation of log returns and the standard deviations parameter. This gives an at a glance view of the expected, but not “black swan” risk.
It’s not a complete picture for risk management, but still a necessary component to know what kind of daily PnL swings to expect from a position. If you’re holding a position that historical volatility tells you could bankrupt you by next week, you’re clearly doing something wrong. You should always be aware of the “baked-in” risk, but also never forget that past performance is not indicative of future results.
You can download the indicator here.